This is a post on how to monitor your Pfsense firewall with an ELK stack (Elasticsearch, Logstash and Kibana) running on docker.
The final goal is to be able to view what is being blocked by your firewall. It is always fun and interesting to be able to review who's scanning you, on what port. With ELK (thanks to logstash), we'll add geoip information to each blocked IPs to be able to draw a map of who's scanning you from which country.
Here are the different steps for this setup:
- install docker
- prepare the configs files
- prepare docker image
- run docker container
- play with the data on Kibana
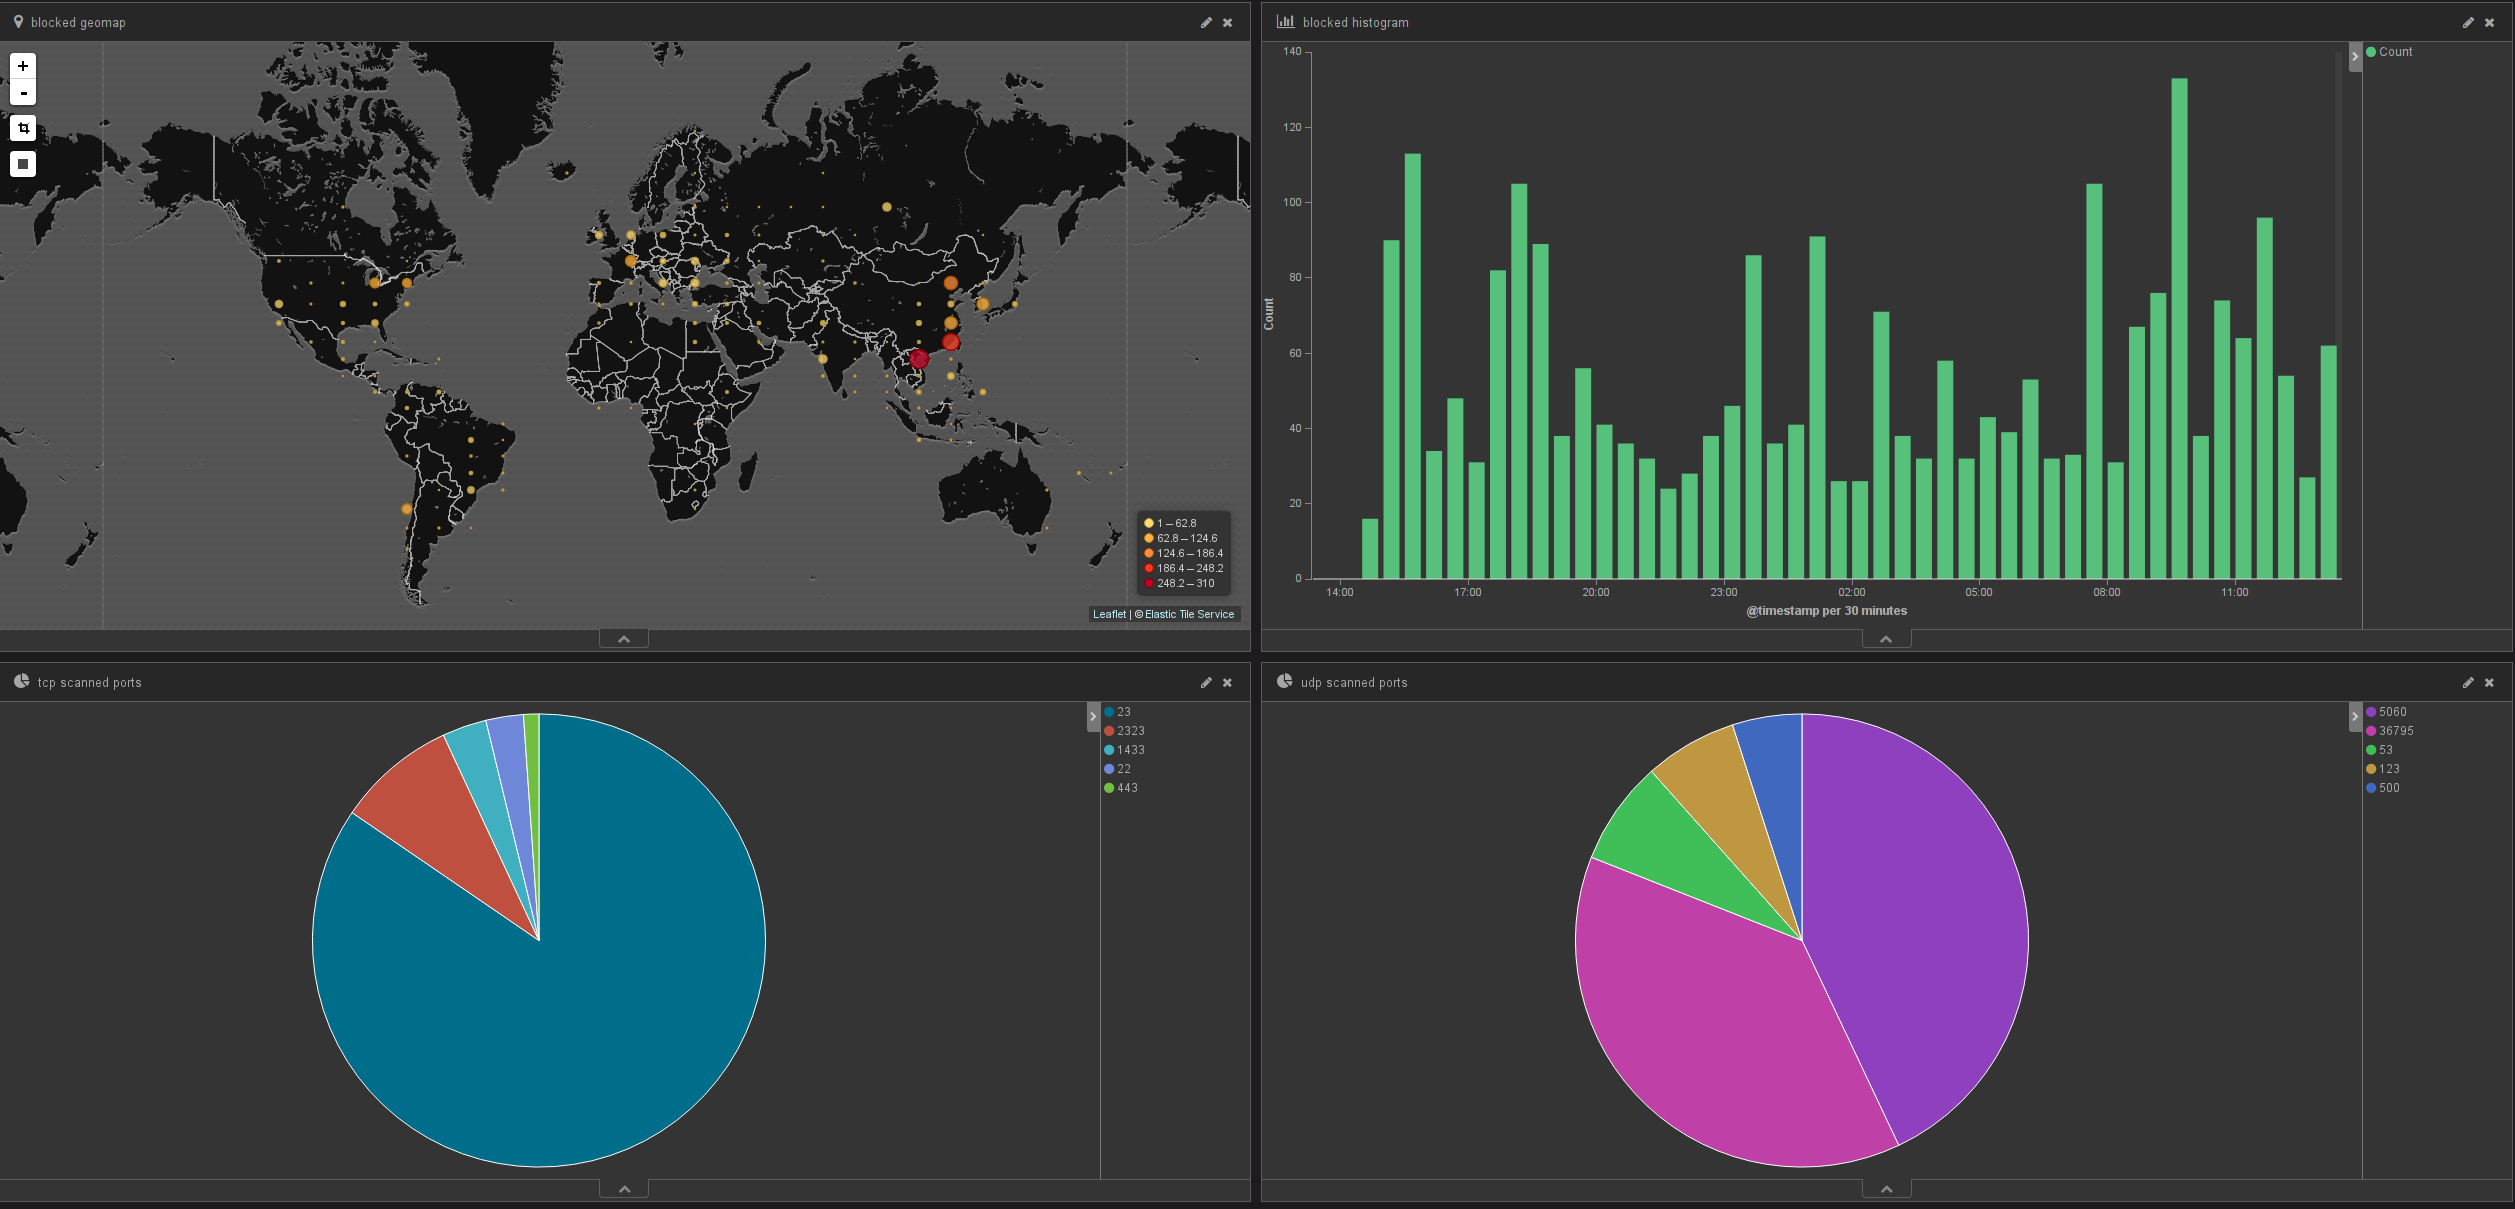
Once done, that's the kind of dashboard you could have to monitor your firewall:
Install docker
Follow the instructions for your distribution on the docker's installation doc.
Once docker's installed, retrieve the docker image on which we will base our stack:
docker pull sebp/elk
All the below files need to be put in the same folder to ease the setup with docker, so start by creating a folder, like for example docker-elk.
Logstash
Logstash is the tool that parses the logs and formats them to a viable structure for Elasticsearch.
The below grok file is used to match each log entry to different fields in order to be correctly parsed by Elasticsearch/kibana.
This file is originally from
this gist, save it into docker-elk/pfsense.2.2.grok.
# GROK match pattern for logstash.conf filter: %{LOG_DATA}%{IP_SPECIFIC_DATA}%{IP_DATA}%{PROTOCOL_DATA}

# GROK Custom Patterns (add to patterns directory and reference in GROK filter for pfSense events):

# GROK Patterns for pfSense 2.2 Logging Format
#
# Created 27 Jan 2015 by J. Pisano (Handles TCP, UDP, and ICMP log entries)
# Edited 14 Feb 2015 by E. Paul
#
# Usage: Use with following GROK match pattern
#
# %{LOG_DATA}%{IP_SPECIFIC_DATA}%{IP_DATA}%{PROTOCOL_DATA}

LOG_DATA (%{INT:rule}),(%{INT:sub_rule}),,(%{INT:tracker}),(%{WORD:iface}),(%{NOTSPACE:reason}),(%{WORD:action}),(%{WORD:rule_direction}),(%{INT:ip_ver}),

IP_SPECIFIC_DATA (%{IPv4_SPECIFIC_DATA}|%{IPv6_SPECIFIC_DATA})

IPv4_SPECIFIC_DATA (%{BASE16NUM:tos}),,(%{INT:ttl}),(%{INT:id}),(%{INT:offset}),(%{WORD:flags}),(%{INT:proto_id}),(%{WORD:proto}),

IPv6_SPECIFIC_DATA (%{BASE16NUM:class}),(%{DATA:flow_label}),(%{INT:hop_limit}),(%{WORD:proto}),(%{INT:proto_id}),

IP_DATA (%{INT:length}),(%{IP:src_ip}),(%{IP:dest_ip}),

PROTOCOL_DATA (%{TCP_DATA}|%{UDP_DATA}|%{ICMP_DATA})

TCP_DATA (%{INT:src_port}),(%{INT:dest_port}),(%{INT:data_length}),(%{WORD:tcp_flags}),(%{NOTSPACE:sequence_number}),(%{INT:ack_number}?),(%{INT:tcp_window}),(%{DATA:urg_data}),(%{DATA:tcp_options})

UDP_DATA (%{INT:src_port}),(%{INT:dest_port}),(%{INT:data_length})

ICMP_DATA (%{ICMP_TYPE}%{ICMP_RESPONSE})

ICMP_TYPE (?<icmp_type>(request|reply|unreachproto|unreachport|unreach|timeexceed|paramprob|redirect|maskreply|needfrag|tstamp|tstampreply)),

ICMP_RESPONSE (%{ICMP_ECHO_REQ_REPLY}|%{ICMP_UNREACHPORT}| %{ICMP_UNREACHPROTO}|%{ICMP_UNREACHABLE}|%{ICMP_NEED_FLAG}|%{ICMP_TSTAMP}|%{ICMP_TSTAMP_REPLY})

ICMP_ECHO_REQ_REPLY (%{INT:icmp_echo_id}),(%{INT:icmp_echo_sequence})

ICMP_UNREACHPORT (%{IP:icmp_unreachport_dest_ip}),(%{WORD:icmp_unreachport_protocol}),(%{INT:icmp_unreachport_port})

ICMP_UNREACHPROTO (%{IP:icmp_unreach_dest_ip}),(%{WORD:icmp_unreachproto_protocol})

ICMP_UNREACHABLE (%{GREEDYDATA:icmp_unreachable})

ICMP_NEED_FLAG (%{IP:icmp_need_flag_ip}),(%{INT:icmp_need_flag_mtu})

ICMP_TSTAMP (%{INT:icmp_tstamp_id}),(%{INT:icmp_tstamp_sequence})

ICMP_TSTAMP_REPLY (%{INT:icmp_tstamp_reply_id}),(%{INT:icmp_tstamp_reply_sequence}),(%{INT:icmp_tstamp_reply_otime}),(%{INT:icmp_tstamp_reply_rtime}),(%{INT:icmp_tstamp_reply_ttime})
Then we need to setup the logstash config so that it:
- listens on UDP port 5000 for logs to parse
- uses the above grok file to parse the entries
- adds geoip to each entry
- outputs to Elasticsearch
Save the following into docker-elk/pfsense.conf
input {
  udp {
    port => 5000
    type => "syslog"
  }
}

filter {
  grok {
    patterns_dir => "/etc/logstash/patterns"
    match => [ "message", "%{LOG_DATA}%{IP_SPECIFIC_DATA}%{IP_DATA}%{PROTOCOL_DATA}" ]
  }
  geoip {
    source => "src_ip"
  }
}

output {
        elasticsearch {
          hosts => ["localhost:9200"]
          codec => "json"
          workers => 1
          index => "logstash-%{+YYYY.MM.dd}"
          manage_template => true
          template_name => "logstash"
          template_overwrite => false
          flush_size => 100
          idle_flush_time => 1
        }
}
Pfsense usually uses re{0-9} as interface names. You could rename those fields directly in logstash by adding an entry like this in the above config under the filter element:
if [iface] == "re0" {
  mutate {
    replace => [ "iface", "WAN" ]
  }
}
Run the stack
Now that we have the configs, let's create the dockerfile as docker-elk/dockerfile:
FROM sebp/elk

# remove logstash config files
RUN rm /etc/logstash/conf.d/01-lumberjack-input.conf
RUN rm /etc/logstash/conf.d/02-beats-input.conf
RUN rm /etc/logstash/conf.d/10-syslog.conf
RUN rm /etc/logstash/conf.d/11-nginx.conf
RUN rm /etc/logstash/conf.d/30-output.conf

# add specific configs
ADD ./pfsense.conf /etc/logstash/conf.d/pfsense.conf
ADD ./pfsense.2.2.grok /etc/logstash/patterns/pfsense.2.2.grok
This tells docker to:
- use sebp/elk as a base image
- remove the configs distributed with the image
- add our specific config files (defined above)
Having all the above files in the same folder, build the docker image with:
cd docker-elk/ && docker build -t elk-pfsense .
And finally run that container with:
docker run -p 5601:5601 -p 9200:9200 -p 5000:5000/udp -v elk-data:/var/lib/elasticsearch -it --name elk elk-pfsense
This does the following:
- link container's port 5601 to your host port 5601 (for Kibana)
- link container's port 9200 to your host port 9200 (for Elasticsearch)
- link container's port 5000 to your host port 5000 (for Logstash)
- create a volume called elk-data to store the data
You can then detach from the docker shell using CTRL + p + CTRL + q
Before getting any further, there are two tweaks than need to be applied to Elasticsearch.
Since we're running a single ES node, the number of replicas must be set to 0. This is done with following command:
curl -XPUT http://localhost:9200/_settings -d '{ "number_of_replicas" :0 }'
You might also want to increase the queue to avoid timeouts on kibana when querying large quantity of data:
curl -XPUT localhost:9200/_cluster/settings -d '{"transient" : {"threadpool.search.queue_size" : 2000}}'
Pfsense
Now that our ELK stack si ready, let's redirect the firewall logs from Pfsense to it. Login to Pfsense's web interface and go to Status -> System Logs -> Settings, then scroll down to Remote Logging Options and tick Send log messages to remote syslog server.
Fill the entry Remote log servers with your host running the stack (on port 5000). Also tick the Firewall Events and untick all the others.
See https://doc.pfsense.org/index.php/Log_Settings for more.
Kibana
Connect to Kibana (http://[host-ip]:5601) and create a new time-based index based off this pattern: logstash-*
Then, after a while you should see points coming in kibana on the Discover tab.
Finally create a dashboard with these information: